User interface
uv run obd-diag-gui
Choose port and baud rate at the top (the list shows adapters that were found, a path can also be typed in) and press “Connect & Scan”. This reads trouble codes, readiness, freeze frame, VIN and the counters for the used-car check in one pass, read-only. The vehicle (manufacturer and VIN) then appears at the top right, below it six tabs. Adapter, protocol and battery voltage (red when the voltage is low) are shown at the bottom.
The user interface speaks English and German: Options → Sprache / Language
(Language). The pictures on this page come from the emulator
(tools/docs_screenshots.py --lang en) and follow the light or dark theme of this
website.
Trouble codes
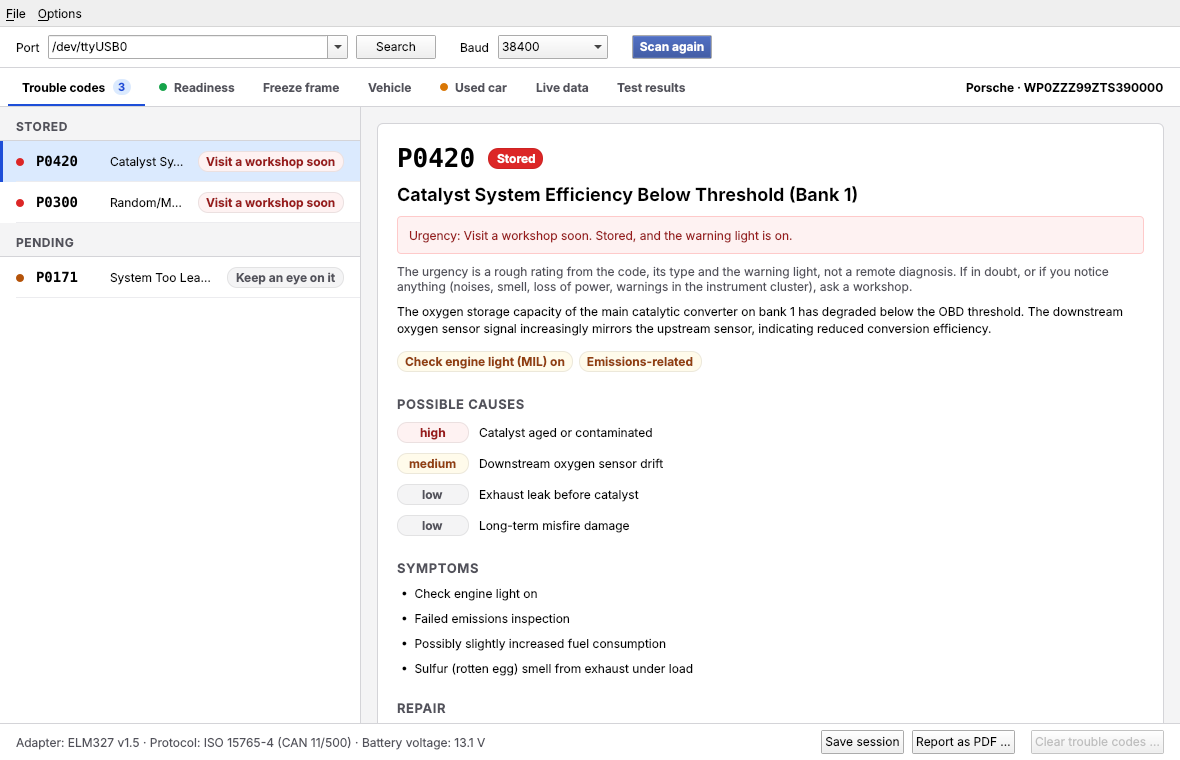
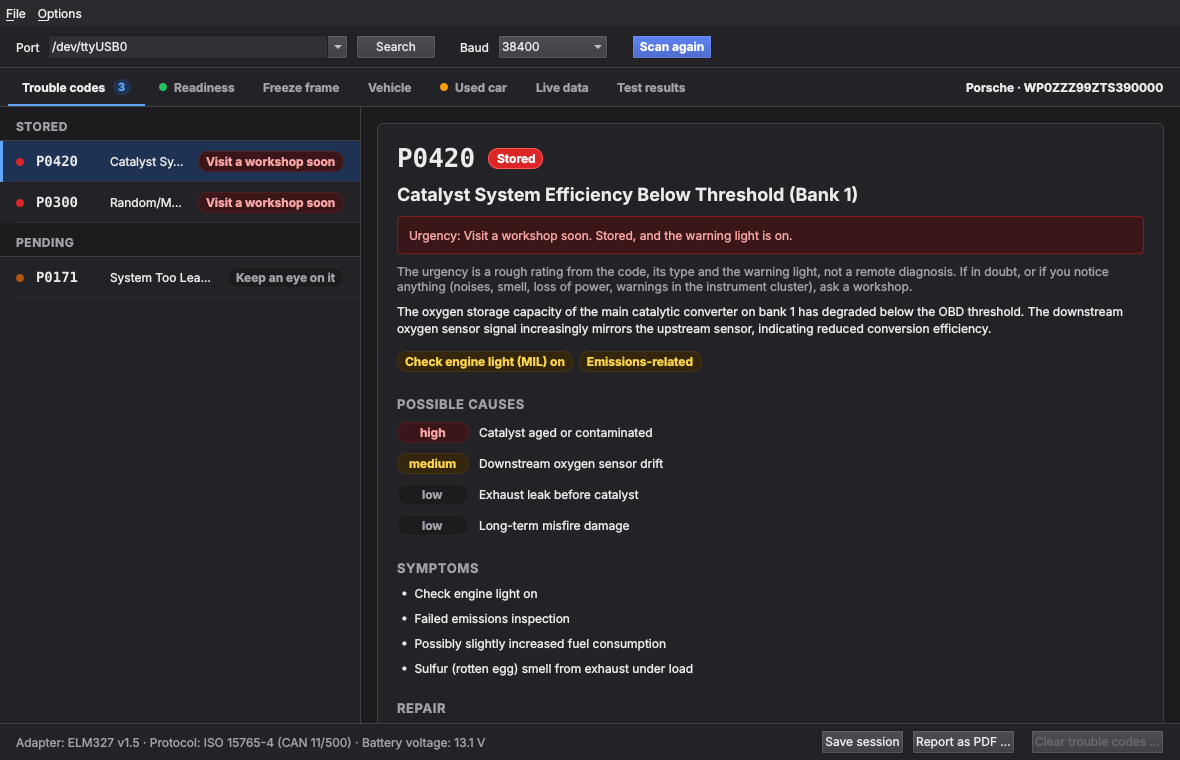
On the left the codes, grouped into stored, pending and permanent; on the right the explanation of the selected code with causes and their likelihood, symptoms and cost range from the offline catalog (Reading and clearing trouble codes). A label per code shows the urgency, the detail view its reason. If a code is missing from the catalog, “Search the web” opens a web search in the browser; with “Explain trouble codes online” an unverified short explanation appears there as well (Explaining trouble codes online).
Readiness
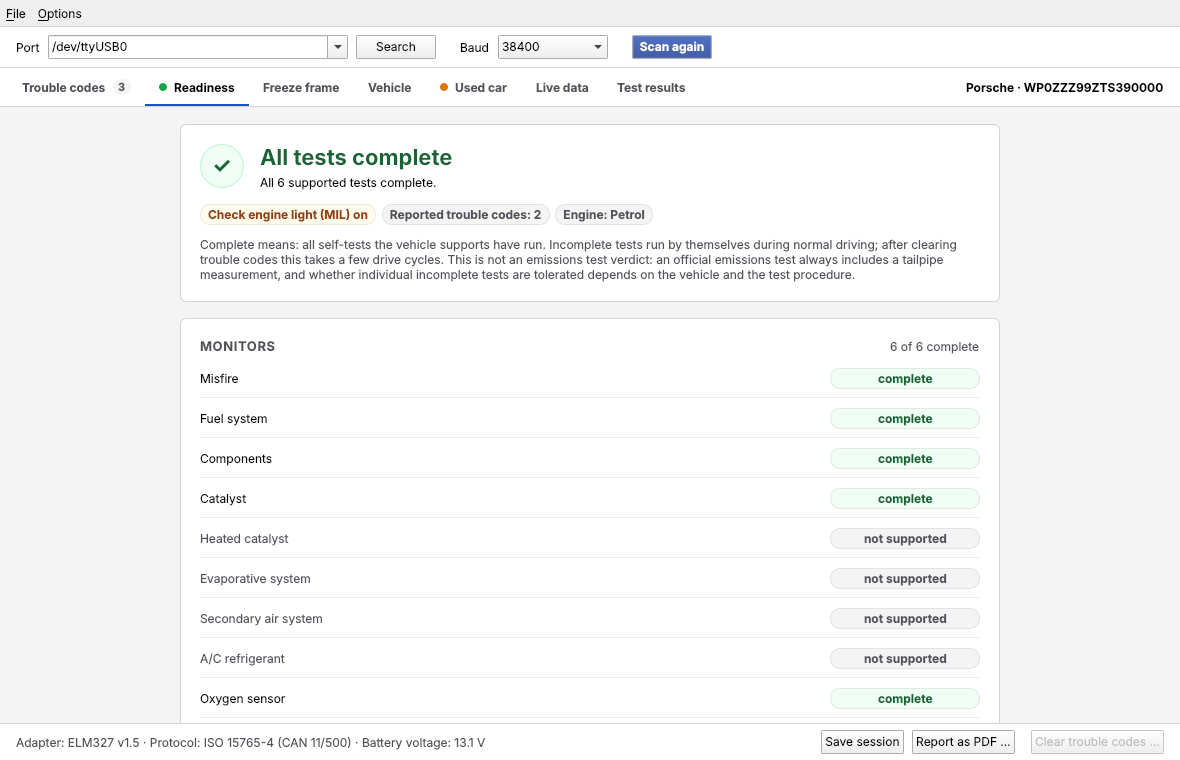
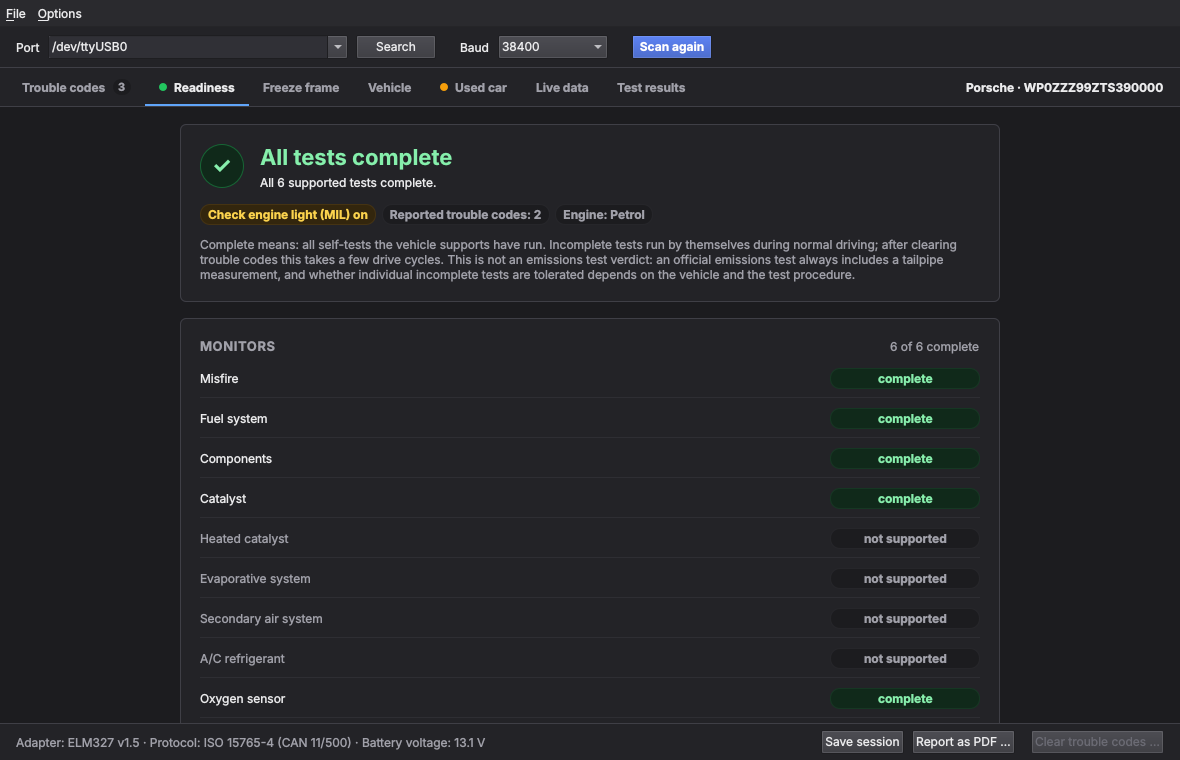
“All tests complete” (green) or “Not all tests complete” (yellow) with the incomplete tests, check engine light, engine type and each monitor as complete, incomplete or not supported. This is deliberately not an emissions test verdict (Sessions, report and trace).
Freeze frame
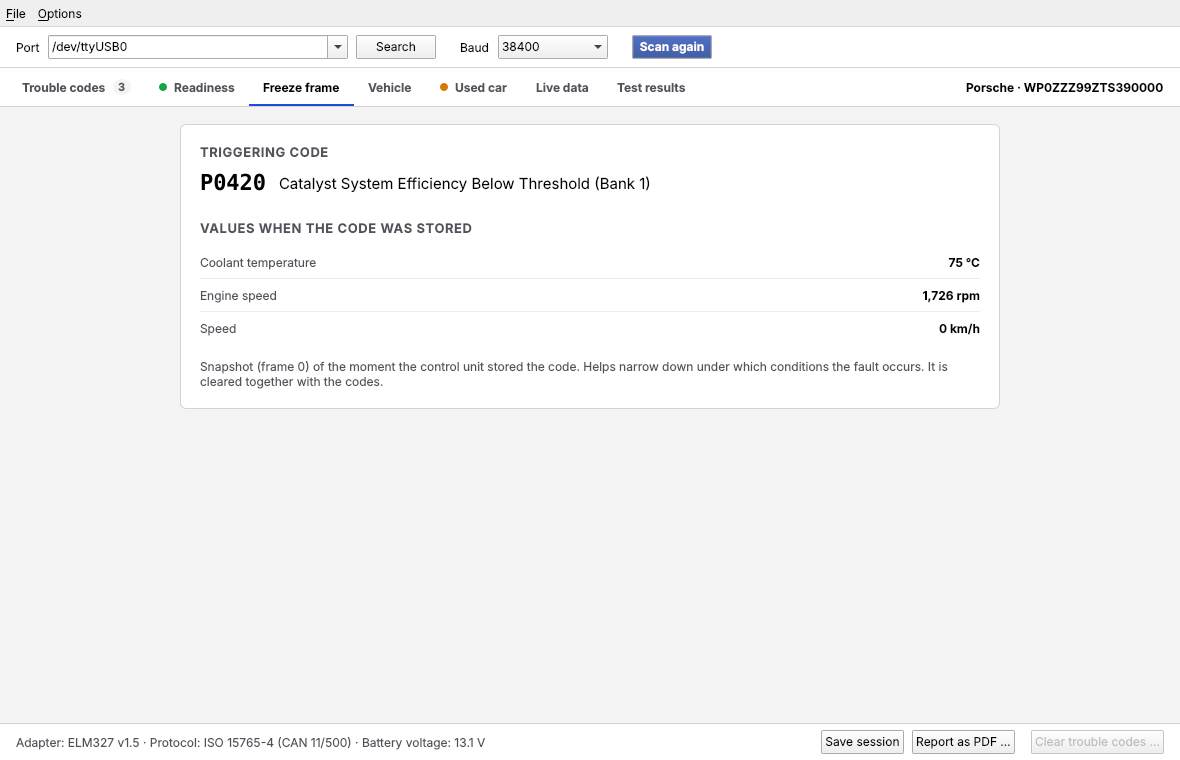
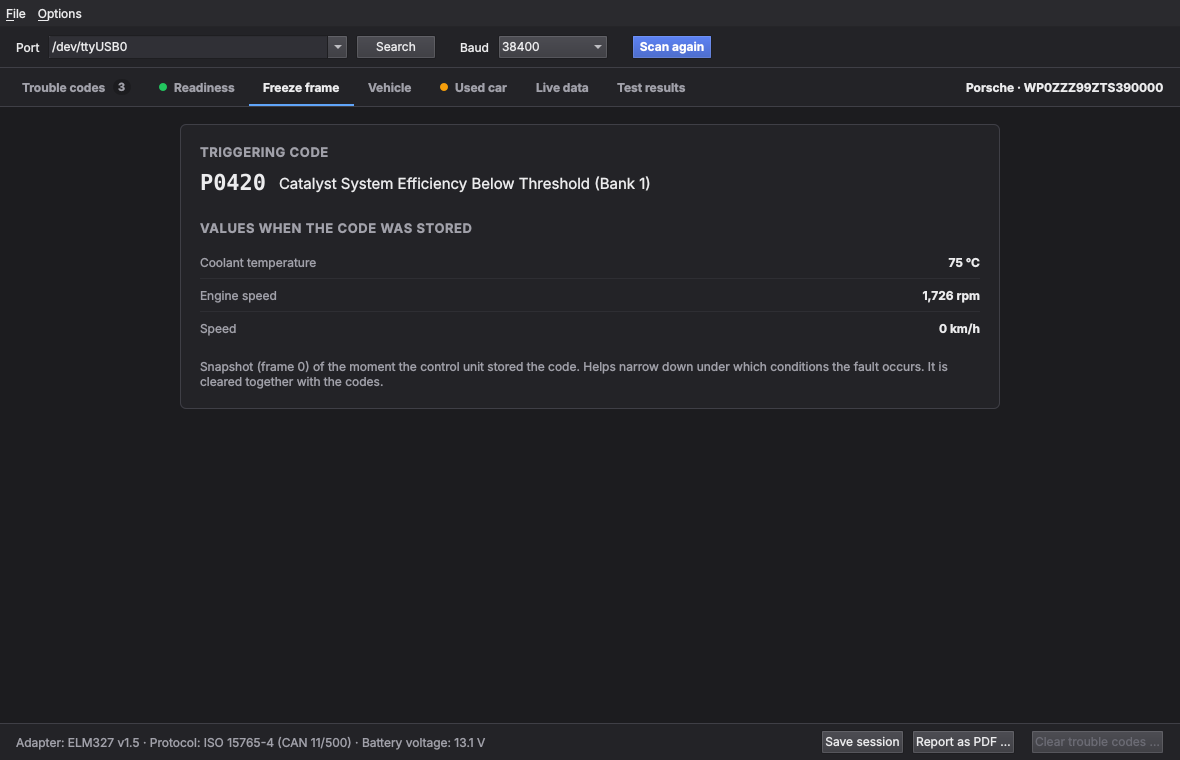
The triggering code and the values when the code was stored: engine load, coolant temperature, engine speed, speed.
Vehicle
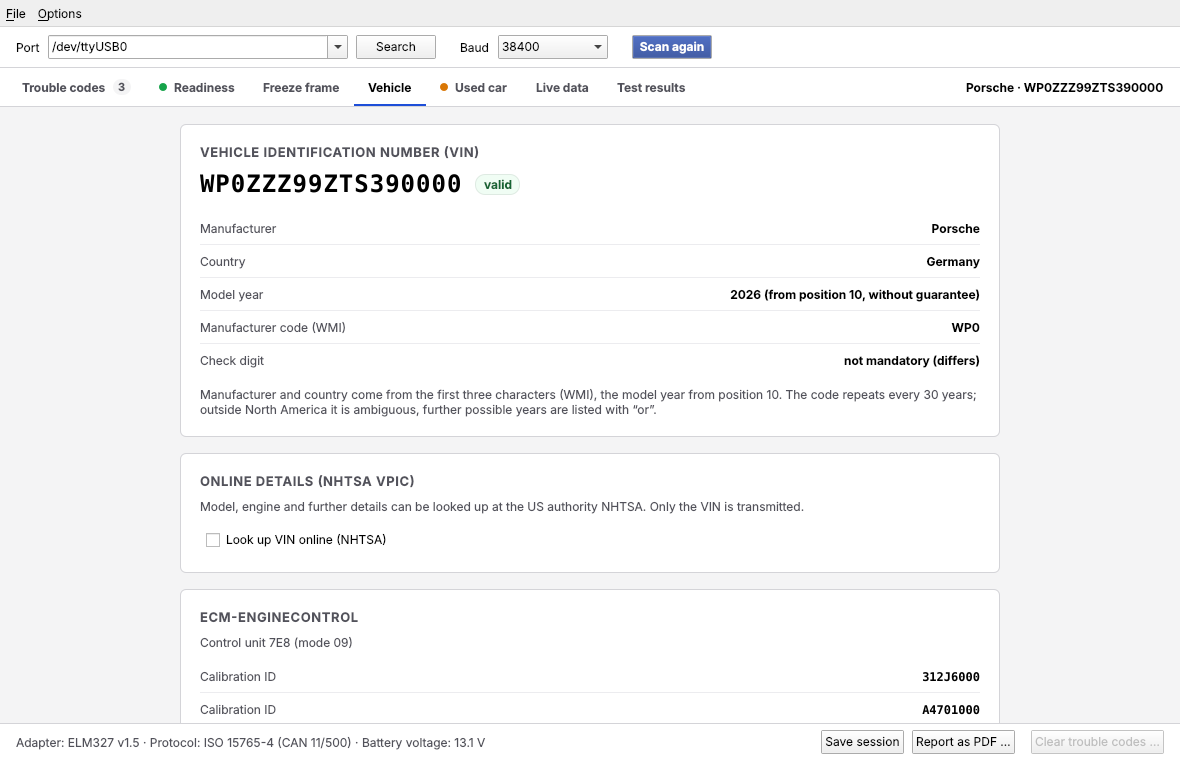
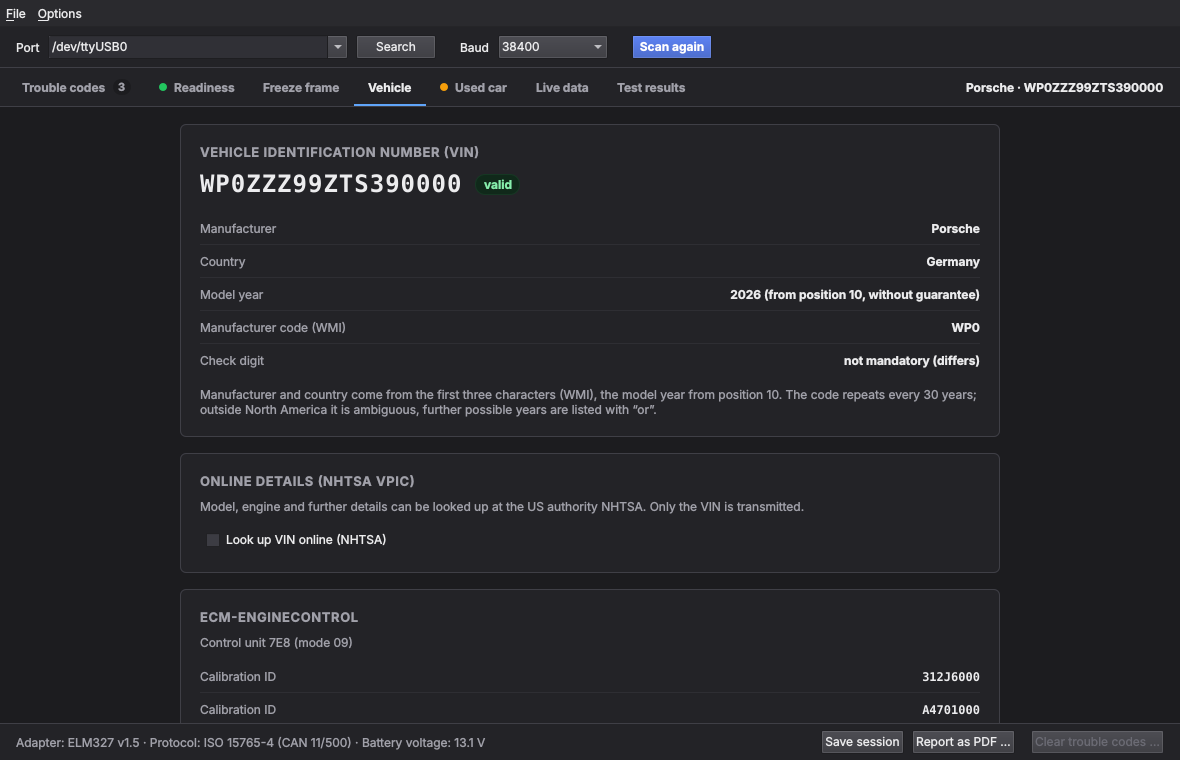
VIN, manufacturer, country, model year and check digit (VIN decoding). “Look up VIN online (NHTSA)” (menu Options or here) is off by default; when switched on, only the VIN goes to the US authority NHTSA at the next scan.
Used car
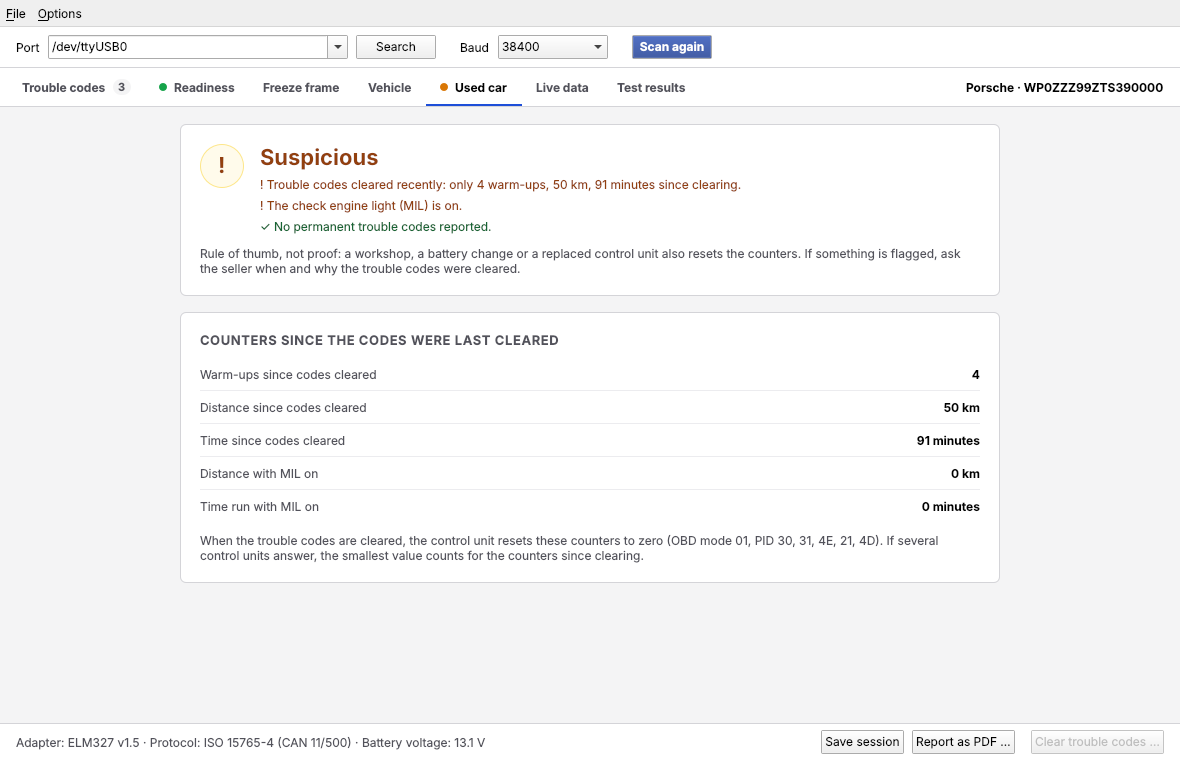
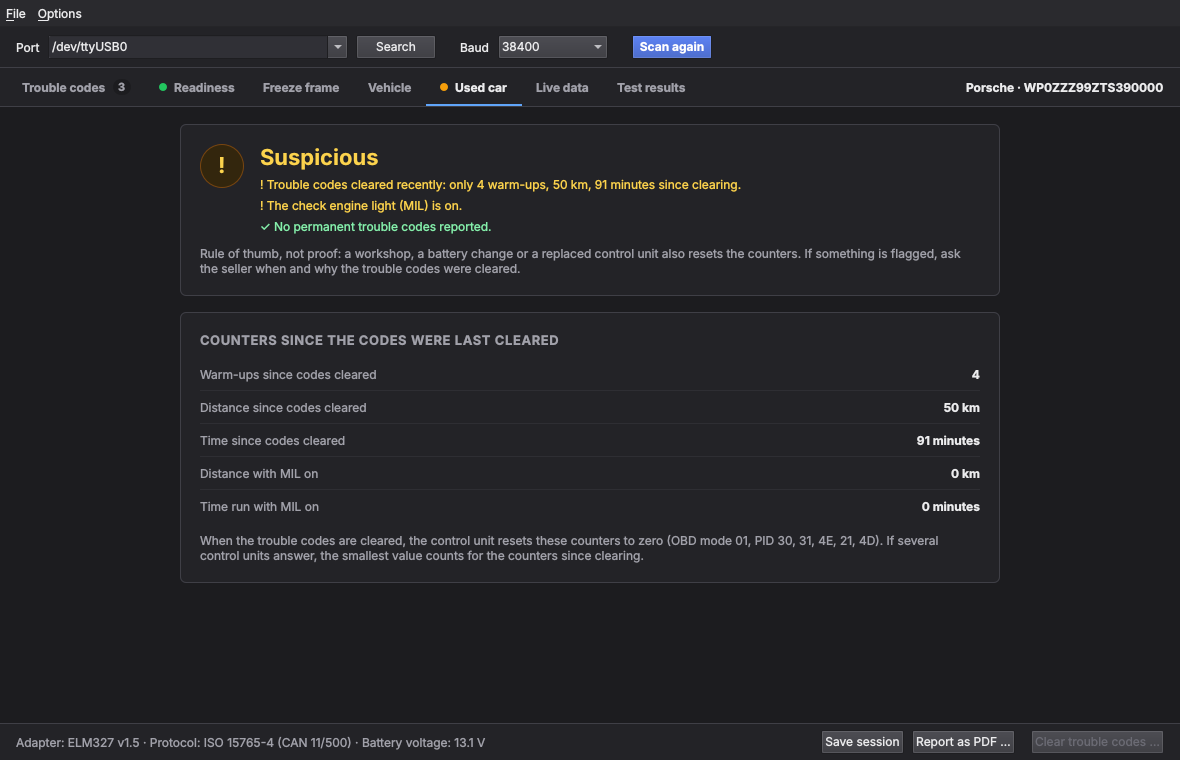
Whether the trouble codes were cleared recently: verdict (suspicious, inconspicuous, cannot be assessed) with the findings, and below it the counters since the codes were last cleared (Used-car check). The dot on the tab is orange when something is flagged.
Live data
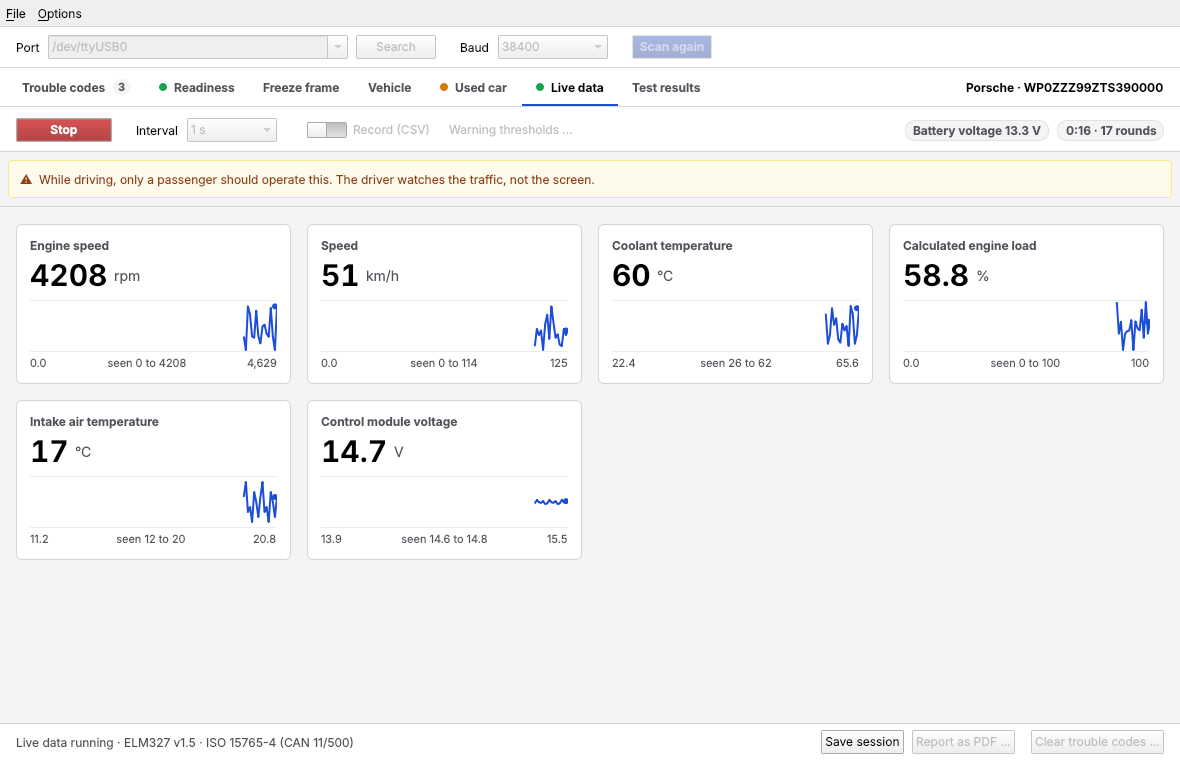
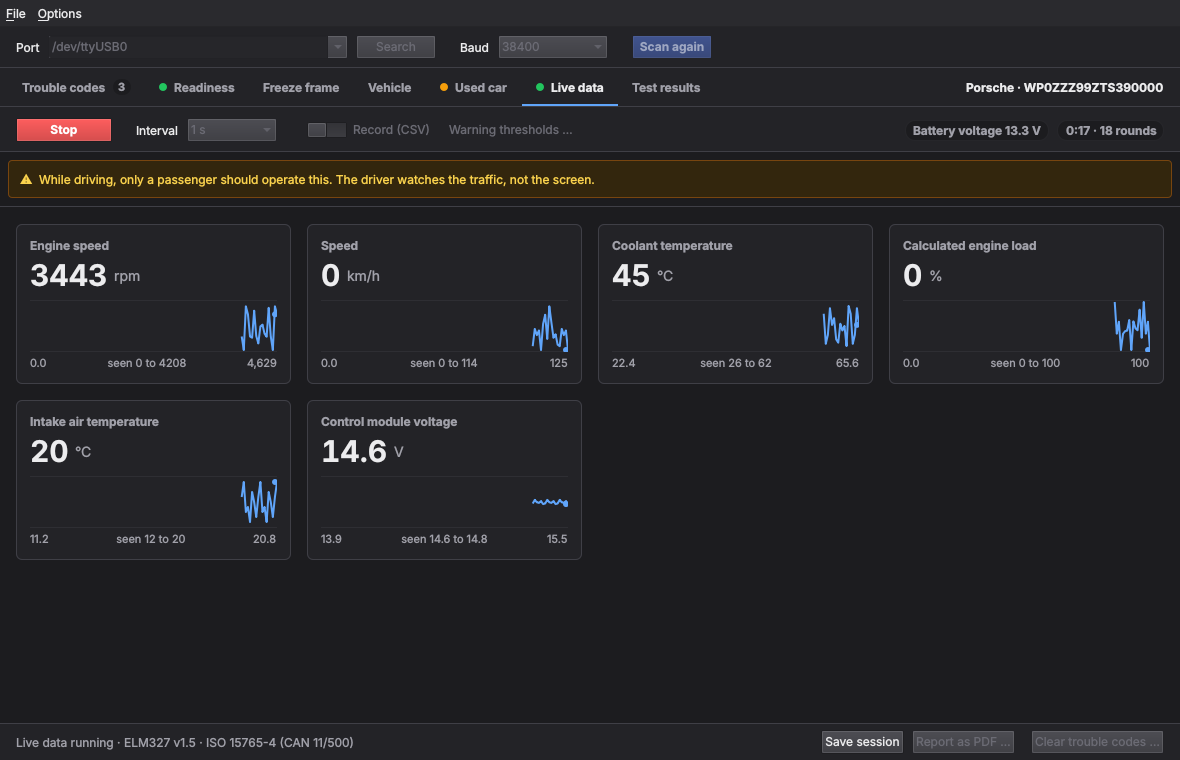
Choose values (the ones the vehicle supports appear after the first start), interval 0.5, 1 or 2 s, optionally “Record (CSV)”, then Start. One tile per value with the current value, the smallest and largest value seen and a curve of the last 120 values. “Warning thresholds …” sets limits per value; when one is exceeded, the tile turns red. While live data is running, scan, clearing and export are locked, because only one action runs on the adapter at a time (Live data).
Trying it against the emulator
Without any tool, the demo vehicle works (port “demo”, Try it without a car). The emulator, on the other hand, can report arbitrary trouble codes:
uv run python tools/emulator.py   # shows the pty, e.g. /dev/pts/5
uv run obd-diag-gui               # enter /dev/pts/5 in the port field, connect